
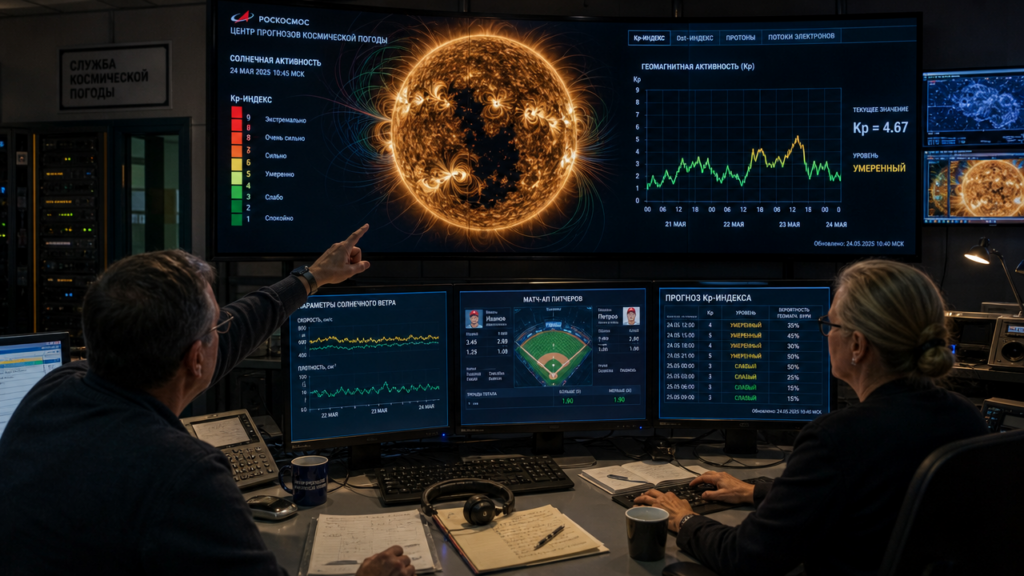
A daily assessment begins with solar ultraviolet and coronal observations, X-ray and proton-flux measurements, and the planetary K index. Current readings list a sunspot count of 110 and radio flux of 105. Solar activity data also include the number and classification of active groups.
Kp index and geomagnetic storm scale
The space-weather storm scale defines G1 as Kp=5, G2 as Kp=6, G3 as Kp=7, G4 as Kp=8–9, and G5 as Kp=9o. A coronal hole can produce high-speed solar wind, and its parameters help forecasters estimate wind speed near Earth.
The magnetosphere interacts with the solar wind, producing currents that numerical models can visualize. Measurements of energetic particles from an orbiting satellite also contribute to space-weather analysis.
Forecasting data and models
Forecast centers combine solar images, solar-wind speed and density, magnetic-field measurements, and geomagnetic indices such as Dst, NT, Ap, and Kp. Real-time services use autonomous models to estimate solar activity and geomagnetic conditions, while archived data support longer-term analysis.
Current outlook
The current forecast lists activity near Kp2–4− on Saturday, Kp2–3 on Sunday, and Kp1–2 on Monday. The last recorded geomagnetic storm reached Kp5 on 8 September 2026. The latest listed X-class flare was X1.3 on 4 July 2026, while the latest M-class flare was M1.0 on 5 September 2026.